



Before all else, a note from our
Founder & CEO
Our third quarterly update examines a property sector with improving income but a more demanding investment backdrop. Renewed inflation and higher interest rates have challenged valuations in South Africa and overseas. The priority is to identify businesses that can sustain distributions, fund their obligations and invest sensibly through this uncertainty.

SOUTH AFRICAN AND INTERNATIONAL LISTED PROPERTY
Quarter ended 30 September 2026
Executive Summary
Q3 exposed the gap between stronger property earnings and weaker share prices. The SA REIT Association return series declined 2.10% over the quarter, despite a September recovery. International listed property also fell, with Europe suffering the sharpest regional decline in the FTSE EPRA Nareit global series.
September results from major South African landlords confirmed improving distributions. The more useful question is how much of that growth is repeatable. Operating gains, lower historical finance costs and changes in payout ratios contributed in different proportions. Renewed monetary tightening makes those distinctions increasingly important.
Our assessment remains selective. Well-located retail, logistics and established precinct assets can support durable income. Offshore diversification adds access to different demand drivers, but introduces currency, financing and capital expenditure risks. Neither a high yield nor a discount to reported net asset value is sufficient evidence of value.
SOUTH AFRICAN LISTED PROPERTY PERFORMANCE
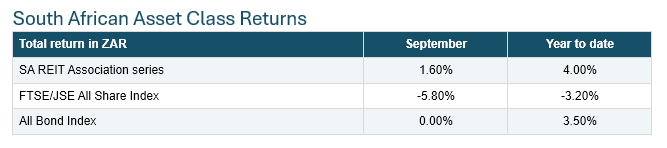
September provided a recovery after a difficult quarter. The SA REIT Association series gained 1.60% in the month and ended September up 4.00% year to date. Its Q3 return was -2.10%. The September gain coincided with a sharp fall in broader equities, demonstrating useful relative resilience, although one month does not establish defensive behaviour through a full cycle.
Rolling 12-month distribution growth in the Association’s series reached 11.09%. This supports the income recovery but is a backward-looking aggregate. It should not be treated as a forecast for every landlord or as evidence that distributions will keep growing at the same rate.
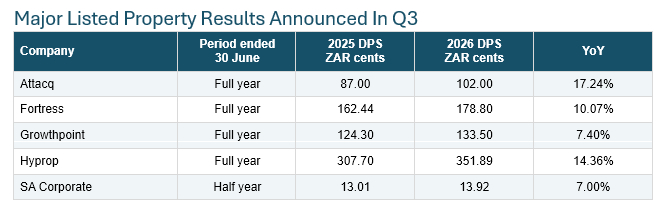
Attacq’s normalised distributable income per share rose 15.5%, alongside higher occupancy. Growthpoint’s dividend growth of 7.4% exceeded its 4.3% growth in distributable income per share, reflecting a higher payout ratio. Investors should distinguish improved earnings from a greater proportion of earnings being distributed.
The next financial year looks less forgiving. Growthpoint guided to 1%–3% growth in both distributable income and dividends per share for FY2027. Hyprop guided to 7%–9% growth in distributable income per share. Both are management forecasts subject to assumptions, rather than guaranteed returns. Fortress’s September guidance assumed unchanged SARB and ECB interest rates. Both central banks subsequently raised rates during the month, creating a reason to reassess that assumption when evaluating the forecast.
SOUTH AFRICAN ECONOMY
Inflation and funding costs
The SARB raised the repo rate by 25 basis points to 7.25%, effective 25 September. It has forecast 2026 economic growth of 1.2% and warned that the renewed fuel shock could lift headline inflation above 5% later in 2026 and early 2027. August CPI, the latest release available at quarter-end, was 4.4%, up from 4.3% in July. [2, 3]
For property investors, the pressure works through both tenant demand and financing. Higher fuel and utility costs leave less room for discretionary spending and rent increases. Floating-rate debt reprices sooner; fixed-rate debt and hedges defer the impact. The key measures are debt maturities, hedge expiry dates, interest cover and cash available after maintenance spending.
Retail Property Sector
Retail results support resilience without proving that every format is equally strong. Hyprop’s South African portfolio reported trading density growth of 5.5% and positive rental reversions of 8.7% for FY2026. Fortress’s South African retail portfolio delivered 7.3% like-for-like net operating income growth. These outcomes demonstrate that established shopping centres can generate growth alongside convenience retail.
Grocery and service-led centres offer recurring demand, while dominant regional malls can benefit from tenant investment and stronger destination appeal. The risk is that nominal sales growth masks weak volumes or rising tenant occupancy costs. Sustainable rental growth depends on tenant profitability, collections and the cost of keeping each centre competitive.
Industrial Property Sector
Logistics remains attractive where location, building specifications and tenant demand support occupancy. Fortress reported 8.4% like-for-like net operating income growth in its South African logistics portfolio for FY2026. That is company evidence of operational strength, rather than a national rental-growth benchmark.
Development should still clear a demanding hurdle. A low vacancy rate does not justify construction at any price. We favour credible pre-letting, strong tenant covenants and development yields that retain a margin over the eventual cost of funding. Speculative supply, rising construction costs and weak tenant concentration limits can erode the apparent advantage.
Office Property Sector
The office investment case remains specific to location and asset quality. Growthpoint’s FY2026 reporting identified Gauteng office conditions and negative rental reversions as continuing challenges. A recovery in a well-managed precinct should therefore not be extrapolated to secondary buildings or to the national market.
Investors should assess effective rent after incentives, leasing expenditure, maintenance requirements and the income lost during refurbishment. Occupancy is useful, but an occupied building can still deliver a poor cash return if retention is expensive. Conversion or redevelopment opportunities require credible demand and cost estimates, rather than a convenient escape from an office vacancy.
INTERNATIONAL LISTED PROPERTY
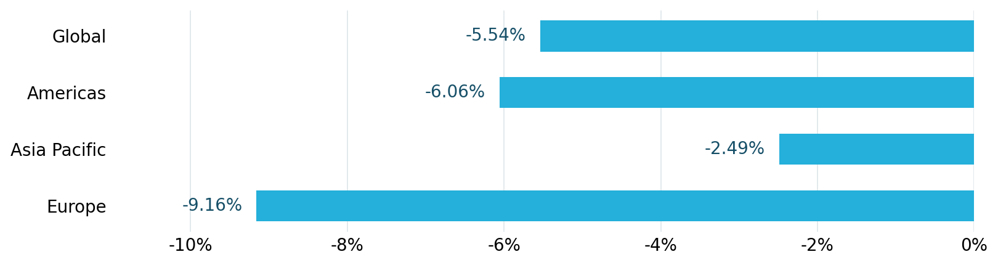
The international sell-off showed how quickly higher discount rates can outweigh improving income. The FTSE EPRA Nareit global series returned -5.54% in Q3 in USD. Asia Pacific declined less than the Americas and Europe, although the regional figures include currency movements and conceal substantial differences between markets.
Regional Q3 Total Returns in USD
United States
The FTSE Nareit All Equity REITs Index returned -6.06% in Q3 and -5.73% in September, while remaining approximately 7.9% higher year to date. The Federal Reserve raised its target range by 25 basis points to 3.75%–4.00% in September. The US 10-year Treasury yield ended September at 5.27%, compared with 4.44% at end-June. [10, 11]
This combination raises the return hurdle for new acquisitions and developments. Stronger leasing can support earnings, but it cannot eliminate refinancing risk or justify an unlimited valuation multiple. Balance sheet flexibility matters most where growth requires substantial fresh capital.
INTERNATIONAL MARKETS AND SECTOR THEMES
Europe and the United Kingdom
Europe was the weakest region in the global series, with a Q3 USD total return of -9.16%. The ECB raised its deposit rate to 2.50% in September, while the Bank of England held Bank Rate at 3.75%. A common assumption of progressively cheaper debt is therefore inappropriate across the region.
We favour landlords whose rental growth can cover higher finance costs and the expenditure needed to maintain competitive buildings. Inflation-linked leases may protect revenue, but recoverability, tenant affordability and lease terms determine the benefit. Large NAV discounts deserve scrutiny where appraisals lag financing conditions or substantial refurbishment costs remain unfunded.
Asia Pacific and Singapore
Asia Pacific’s smaller Q3 decline should not obscure different monetary and property cycles. Singapore-listed REITs raised at least S$4.5 billion of equity by 10 September, according to SGX Research’s REIT Watch column. This demonstrates access to capital but does not itself establish an improvement in value per unit.
Keppel DC REIT’s September placement was increased to $625 million to help fund proposed Japanese data centre acquisitions. Such transactions can extend a portfolio’s growth opportunities, but investors should test acquisition pricing, new-unit dilution, financing assumptions and the resulting distribution per unit. Scale is useful only if the economics improve.
Data centres and other specialist property
US data centre REITs remained strong year-to-date performers, returning 28.0% through September, despite falling 3.8% in that month. Demand growth and a strong investment narrative can coexist with share-price volatility. Power availability, customer concentration, lease structure and expenditure on upgrades remain central underwriting questions
Health care, residential and student accommodation provide access to different demand drivers. Their investment cases still depend on operating costs, regulation, tenant or operator credit quality and development economics. Specialist property is a source of diversification, not an exemption from financial discipline.
OUTLOOK FOR Q4 2026
Our base case is for continued differentiation between landlords, rather than a broad rerating driven by imminent rate cuts. South African income fundamentals provide support, but higher funding costs and slower growth may limit the pace of improvement. Internationally, the most credible opportunities combine resilient demand with sufficient capital to fund it.
A sustained easing in energy prices and bond yields would improve the outlook. A longer inflation shock would put pressure on valuations, tenants and refinancing. We therefore place greater weight on liquidity and income durability than on a single year of strong dividend growth. Currency exposure also matters: offshore USD returns translate into a different result for a ZAR investor.
STRATEGIC IMPLICATIONS
For Q4, our preferred approach is selective exposure to established retail catchments, logistics assets with credible tenant demand, and mixed-use precincts with demonstrated leasing strength. International opportunities should add a distinct source of income growth and justify their financing and capital requirements.
We assess distributions after recurring maintenance and leasing costs, and favour companies that can meet debt maturities without relying on favourable equity markets. Reported NAV discounts are a starting point for investigation. They become investable only when asset values, future cash flows and the balance sheet support the case.
Please contact us with any questions about your portfolio. We appreciate your continued support and confidence in us as we manage and grow your wealth.

Vuyani Bekwa: Principal – Private Equity
Vuyani is the Principal – Private Equity with strong expertise in listed property, asset management, fund management and private equity. He holds a B Admin (Economics), University of Western Cape, a Post-Grad Diploma in Business Management and a Master-in-Business Administration (MBA), both from University of KwaZulu-Natal. He also has a FSCA accreditation with the RE5 and RE3 certification.
He began his career as an economic researcher for South Africa’s first socially responsible unit trust in 1995. He then moved into listed property and equity investment analysis when he moved to Marriott Asset Management (now part of Old Mutual Investment Group) in 1997. He then spent 6 years managing listed property portfolios and being the portfolio manager for the Investec Property Equity Fund (now part of Ninety-One). He has spent the last ten years focusing on private equity structures, either setting up or managing capital into funds, some with an impact focus. He is currently busy focusing on the MSM Infrastructure Impact Fund, which is looking for exposure into Industrial and Social infrastructure assets.
Sources and data notes
SA REIT Association September 2026 Chart Book commentary, 1 October 2026
SARB September 2026 Monetary Policy Committee statement, 23 September 2026
Statistics South Africa CPI August 2026, published 23 September 2026
Attacq FY2026 results and dividend declaration, 15 September 2026
Fortress FY2026 results and prospects, 3 September 2026
Growthpoint FY2026 results, dividend declaration and prospects, 9 September 2026
Hyprop FY2026 results, dividend declaration and outlook, 9 September 2026
SA Corporate interim results and distribution declaration, 17 September 2026
Nareit FTSE EPRA Nareit Global Real Estate Index Series Daily Returns, completed Q3 row, USD panel
Nareit FTSE Nareit US Real Estate Index Series Daily Returns, completed Q3 and September rows
Federal Reserve FOMC statement, 16 September 2026
ECB monetary policy decisions, 10 September 2026
Bank of England September 2026 rate decision, 17 September 2026
SGX Research REIT Watch fundraising update, The Business Times, 13 September 2026
Nareit September market and property sector commentary, 5 October 2026
Returns include income where identified as total returns. Source rounding can affect compounded calculations. Interpretive comments and the Q4 outlook are our assessment. Dynamic daily-return reports were accessed on 8 October 2026; only completed Q3 and September observations are used.